What you’ll learn in this article:
-
Every metric you can track and view on Short.io, for all sections — Click Stream, Conversion Stream, Branded Links, and Domain Statistics
-
Each metric is explained in detail, with additional context given for more complex pieces of data
-
A wide variety of use cases that shine a light on how these metrics function in the real world
📈 The promise & challenge of analytics
So — analytics, right?
Clicks, conversions, top performing links, etc.
Short.io provides a large number of ways to understand why and when something works, and if something is lagging behind.
But while all of them are super useful, none of them give you a complete picture.
And even if you track all of them? The way they interact with each other is even more relevant.
In this series of two articles, we want to shine a light on what you should be looking out for and what you can do with that information.
Whether you’re an experienced marketer handling shortlinks for a large corporation or are just running your own project with our free plan, we’ll shed light on everything you need to know.
In this article, we’re only looking at the analytics themselves — what they are, where they are, and what they represent.
We’ll be going through every single one.
In a follow-up article, we’ll be looking at different ways to use your metrics together so you get real, actionable insight. If you’re seeing this, make sure to check back in a couple weeks.
And as a gesture of good faith, we’re going to use our to.short.io domain as an example for this article.
Let’s go.
🤔 The main stats & the questions they answer
If you use Short.io, then you’re already used to some of these metrics.
Others, however, are likely to be new to you. Especially with the recent introduction of “Conversion Stream”.
Let’s take a look in order.
🔗 Branded Links
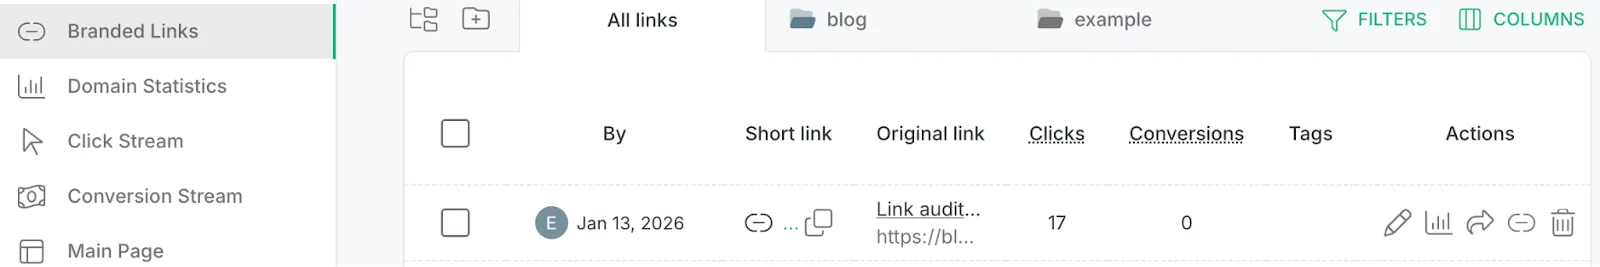
“Clicks” and “Conversions” are the bread and butter of tracking your links’ performance.
If you’re familiar with any Short.io metrics, it’s probably these ones.
What you might be unfamiliar with is what they represent exactly.
Clicks
Counts the total number of human clicks. This excludes crawlers and bots, which can make up 99%+ of your total click count.
Conversions
The total number of actions the user has taken on your website after they click your shortlink.
These can include:
- Pressing “Send” on a form.
- Pressing “Subscribe” on a pricing page.
- Pressing “Buy” on a store page.
As long as the user is doing some predefined action after they click the link, that’s a conversion.
More on that later.
Cool, so that’s covered. What about “Click Stream” and “Conversion Stream”?
👆 🌊 Click Stream
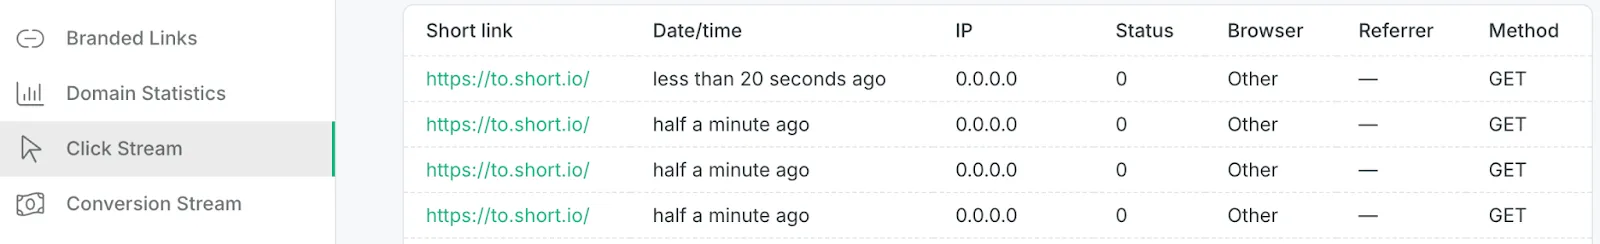
Same clicks, more data.
“Click Stream” allows you to monitor clicks in real time. But not just that — you also get access to a bunch of additional stats. Think of it as expanding the “Clicks” data in “Branded Links”.
Alright, so let’s look at exactly what each data point means, since it’s a bit more nuanced.
- Short link
The URL of the link which got clicked.
- Date/time
When it happened.
- IP
The clicker’s IP address.
- Status
This simply refers to HTML status codes:
- 2xx: Everything is cool
- 3xx: You’re being redirected
- 4xx: An error on your end
- 5xx: A server error on our side
- Browser
Which browser the user used. The number next to the browser name represents the user’s version.
- Referrer
Where the user was before they clicked the link. For example, here the user would have already been on “app.short.io,” which is where they clicked the link “to.short.io”.
- Method
This relates to different ways HTTP can operate your links. While there’s technically five in total (GET, POST, HEAD, PUT, DELETE), you’ll be seeing GET for 99.9% of the time.
- GET
- This is the one you’ll be seeing for 99% of the time. It’s essentially the clicked link telling your browser “GET me this thing.” The browser then pulls the URL for the user, opening it.
With us so far? Good. Next one is a bit more complicated.
✅ 🌊 Conversion Stream
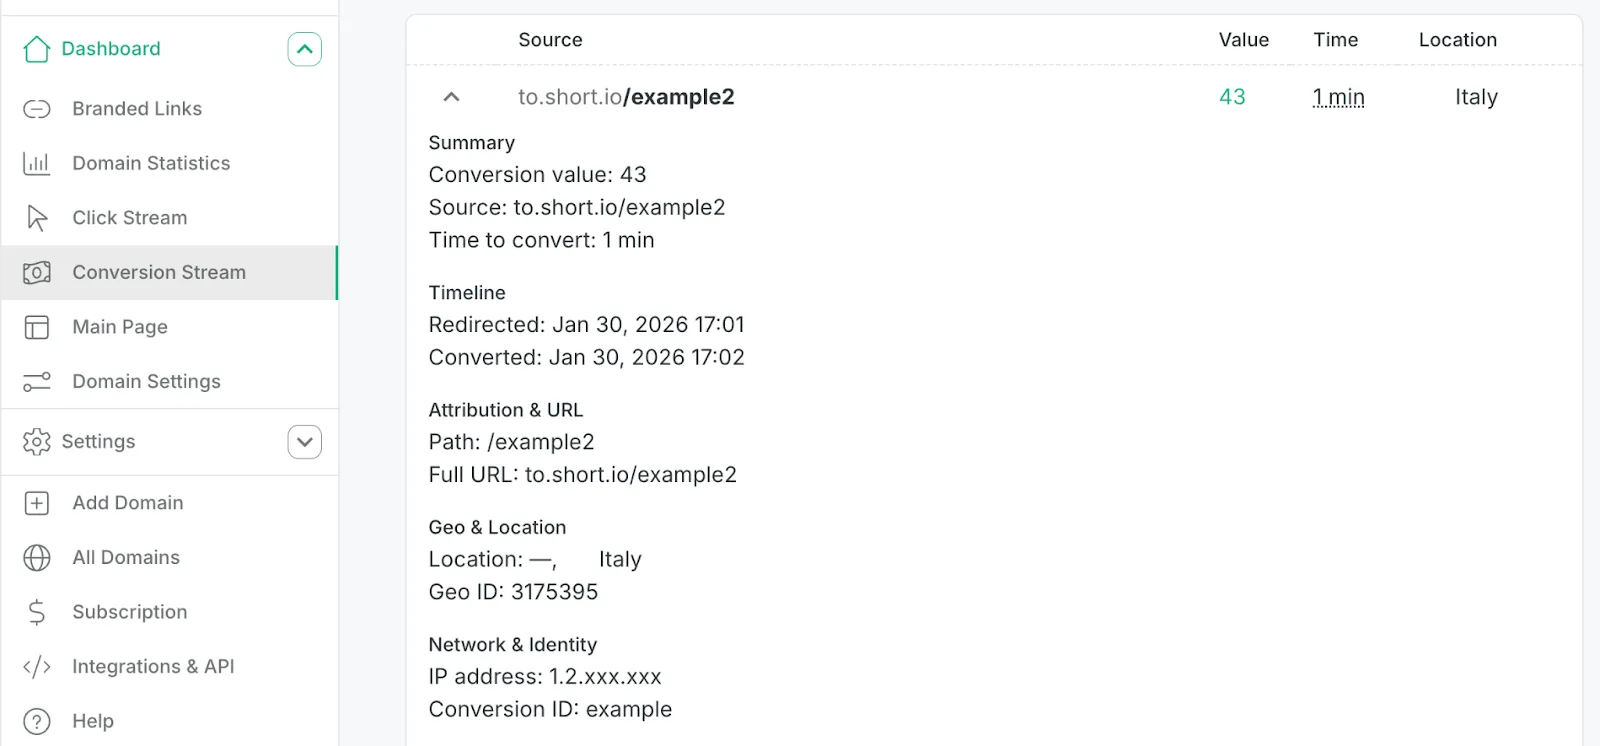
A lot more, but easy to grasp once you know what everything represents.
This is where things start to get a bit more detailed.
But we’ll show you that it’s not too scary. Once it clicks (no pun intended), you’ll be able to understand all the information you need with a single look.
It’s important to note that this does not represent all conversions for one link — it’s the information for a single conversion.
So the information you’re seeing represents each individual time someone files a form, subscribes, or anything else you’ve set up on your website.
One tab per user.
Here are all the metrics featured here.
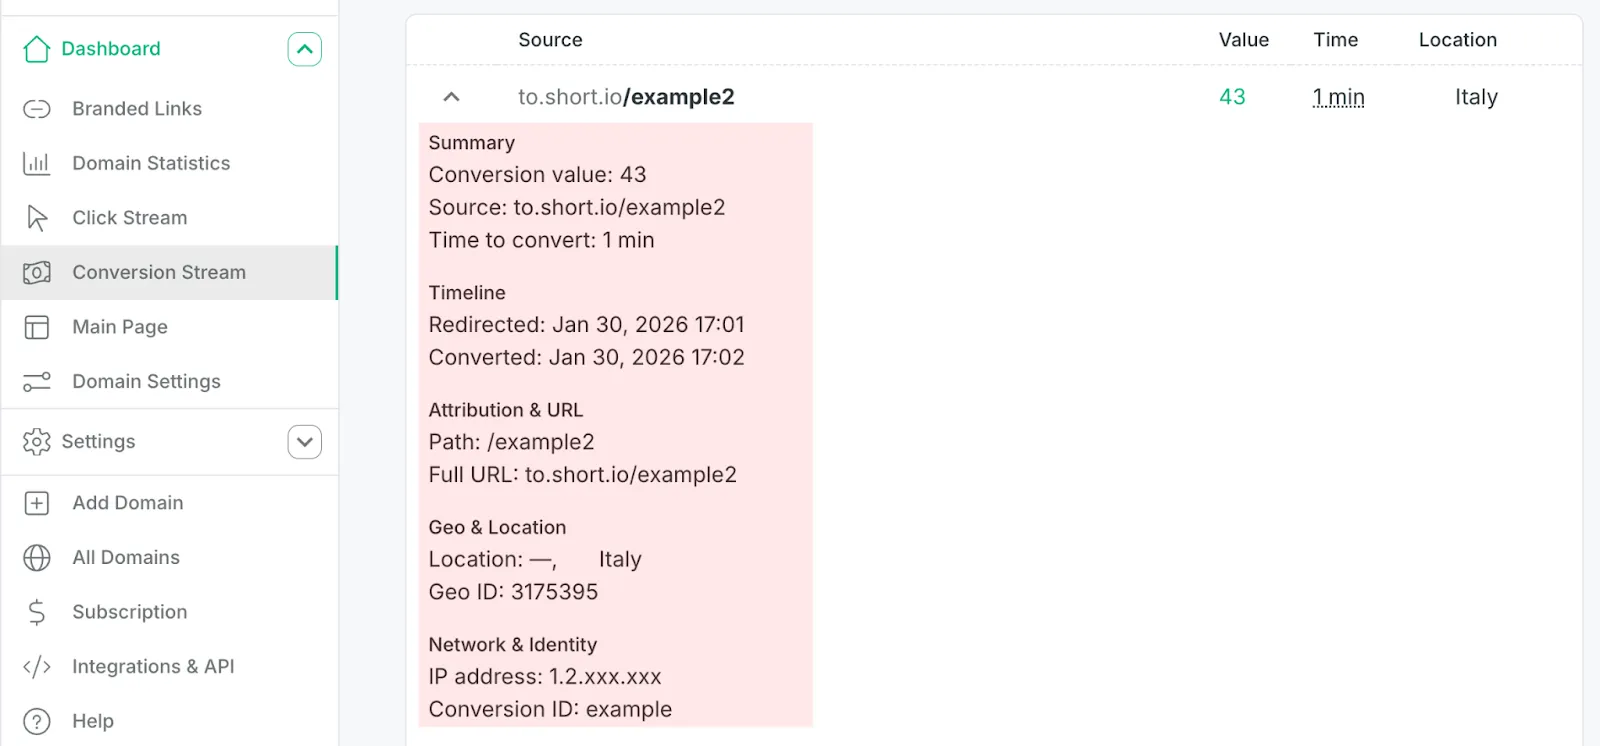
Eleven pieces of relevant information.
Summary
- Conversion value
This one is tricky, as it can mean many things.
Essentially, this is something your Marketing Manager (or whoever else) has to set up. After that, you can track anything you want under the “Value” option.
This can be:
-
Income
- How much you’ve earned from a user subscribing to one of your services, for example.
-
Lead score
- Maybe a newsletter signup is worth 5, a free trial is worth 25, and a demo request is worth 50. You assign values based on how valuable each action is to your business.
-
Points in a scoring system — Arbitrary weighting for comparing campaign performance. “This campaign generated 430 points of value vs. that one’s 280.”
-
Quantity
Number of items purchased, number of tokens in a subscription, etc.
- Contract value
For B2B sales teams, the deal size associated with a lead.
- Source
The page the user was on before they clicked the shortlink. Essentially, the page that houses the shortlink.
- Time to convert
Pretty self-explanatory. Shows how long it took for the user to initiate conversion after clicking on the shortlink. The lower this is, the faster your funnel is working.
Timeline
The exact time the redirect — and then the conversion — happen.
Remember, the redirect happens before the conversion. So the user clicks your shortlink, goes to your page, does the thing, and the conversion gets logged.
Attribution & URL
The “Path” is simply your shortlink’s slug. It shows only what comes after your full domain URL. The “Full URL”, then, shows the whole thing — your domain name and the slug.
Geo & Location
Pretty simple again.
“Location” is where the user initiated the conversion from. Shows both city and country.
Geo ID won’t be particularly relevant for you. It’s just the ID computers use to represent the same information.
Currently, it’s only included here for completeness’ sake.
Network & Identity
Almost done.
- IP Address
The user’s IP address. That’s it.
- Conversion ID
Useful for keeping track of an extra data point in your database.
Just like “Geo ID”, this is included here for completeness’s sake.
And that’s it!
Not that scary anymore, right? You don’t have to be a power user to understand exactly what’s happening.
One last section to go.
🏠 Domain Statistics
This is where we’ll be getting into the meat of things.
It’s what you’ll probably be using most of the time, as it provides the most information out of every tab in the sidebar. And visually, too.
Let’s get started.
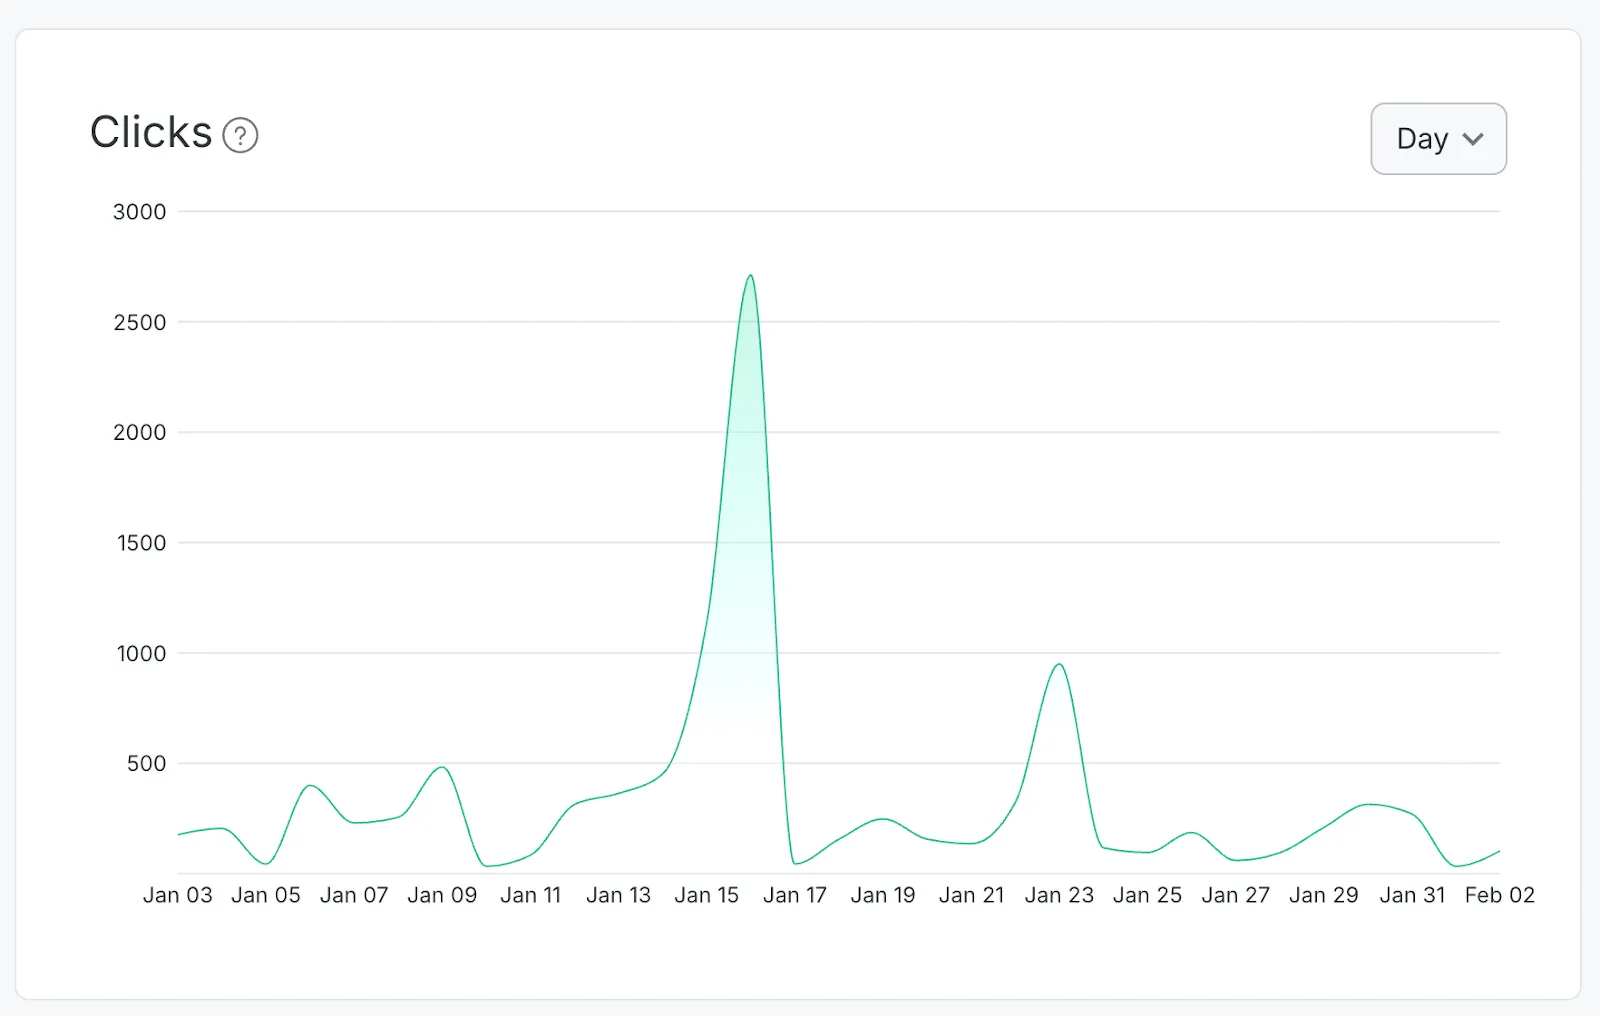
Visualizes the number of total human clicks for a set period.
This represents the total amount of human clicks for your entire domain for the period of time you choose. Probably the most important metric of all.
Unlike what you see in “Branded Links”, this gives you a lot more information on when your shortlinks perform the best.
Another essential set of information.
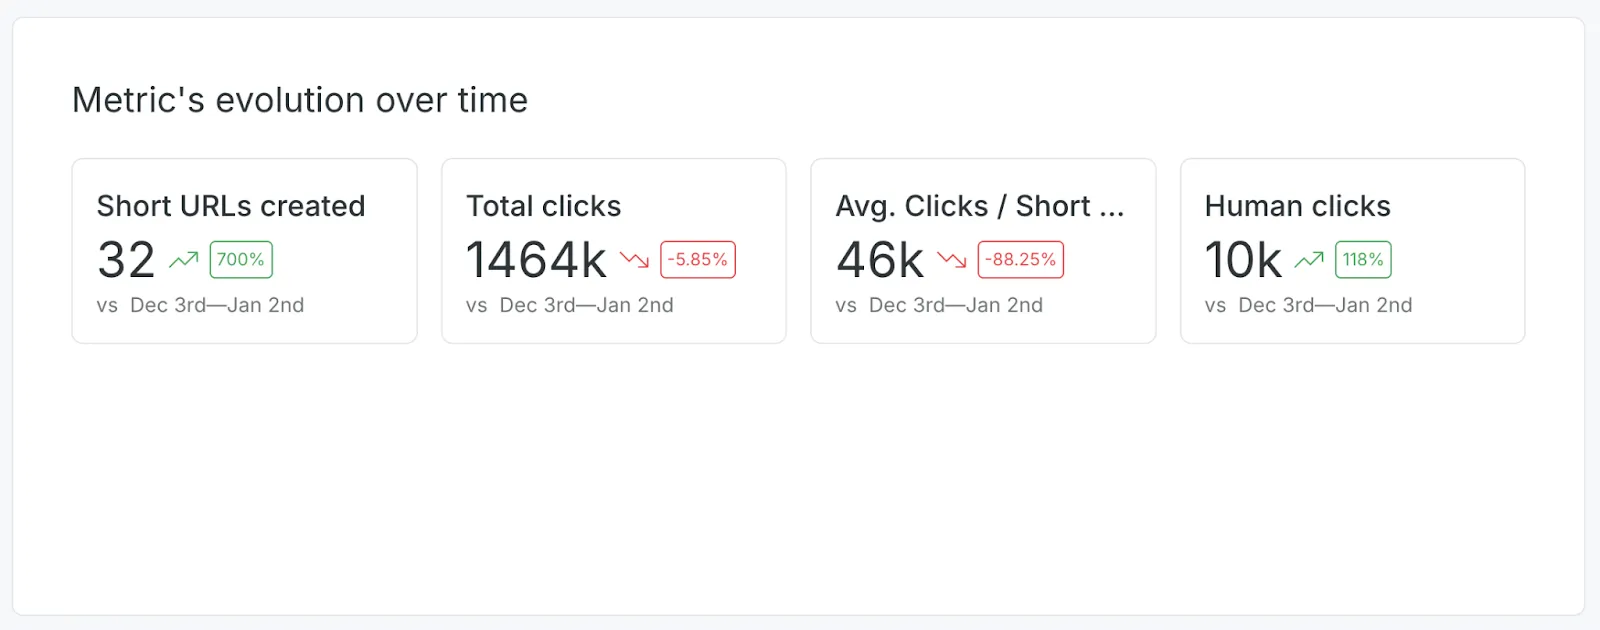
Next up is “Metric’s evolution over time”, which provides a lot of additional information.
- Short URLs created
How many new URLs were created over the last months.
- Total clicks
How many total clicks your domain has received for a set period.
Please keep in mind that this number includes both bots and AI crawlers, which is why this number is so inflated. Bots and AI crawlers can make up 99%+ of your total clicks.
- Avg. clicks / short URL
The average number of clicks per your shortlink’s URLs. Just provides an average for your shortlink total.
- Human clicks
The total amount of clicks that are confirmed to be human. For most cases, this is the number you’ll want to focus on.
Where you’ll spend the majority of your time.
This is probably the most immediately useful part of “Domain Statistics”, and the part you’ll be referencing the most.
Tons of options for understanding your users’ behavior.
From here, you can see in-depth metrics for a wide range of data points.
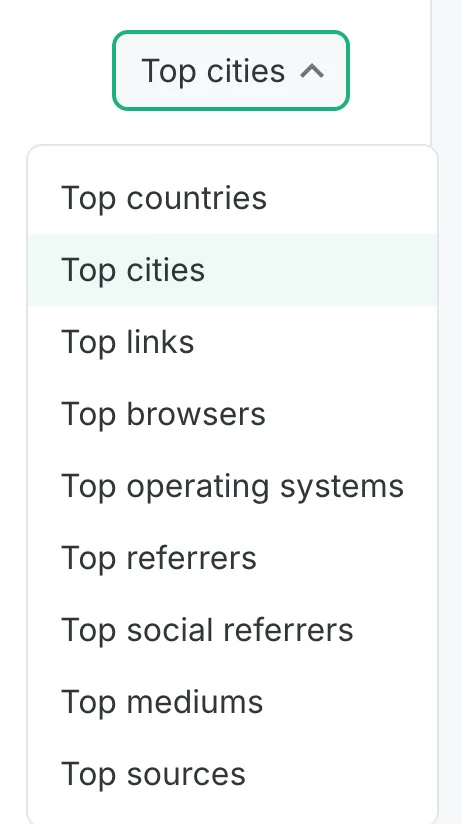
- Top countries
Which countries your users are accessing your links from.
- Top cities
Which cities your users are clicking on your links from.
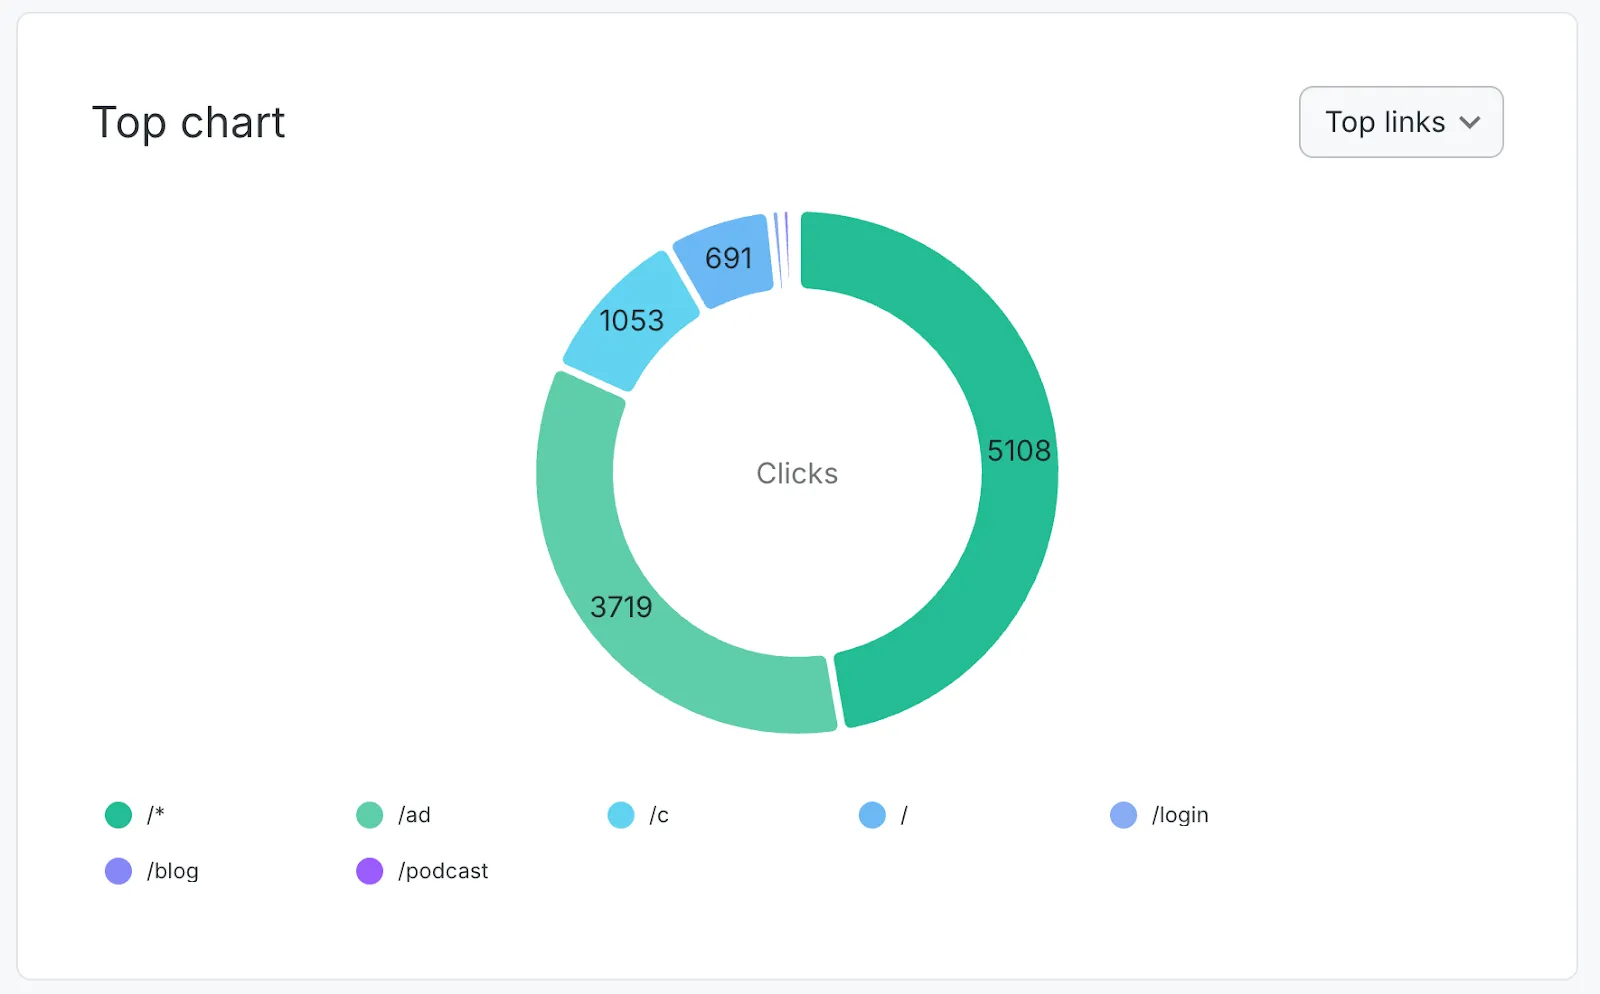
- Top links
Your best-performing shortlinks.
- Top browsers
Showcases all the different browsers your users are using.
- Top operating systems
Windows, Android, and more — every OS your users use to access your links.
- Top referrers
Where users are seeing your links. This does not include social media. That’s “Top social referrers”.
- Top social referrers
The same as “Top referrers”, but specifically for social media.
- Top mediums
This one, “Top sources”, and “Top campaigns” are a bit more complex.
They rely on information pulled from previously set up UTM tags.
If you don’t know what that means, here’s a detailed guide that should be able to get you started.
So, this represents whether users found your links through a search engine, social media, a banner, or anything else you set up.
Think of it as a broad category.
- Top sources
Just like “Top mediums” and “Top campaigns”, this relies on UTM tags.
In this case, it could represent the exact location your clicks are coming from. For example, from a specific newsletter or a partner’s blog post.
- Top campaigns
The last UTM tag option.
It’s simply the overall container for your various mediums (and therefore sources).
So it goes campaign > mediums > sources.
For more information, see here.
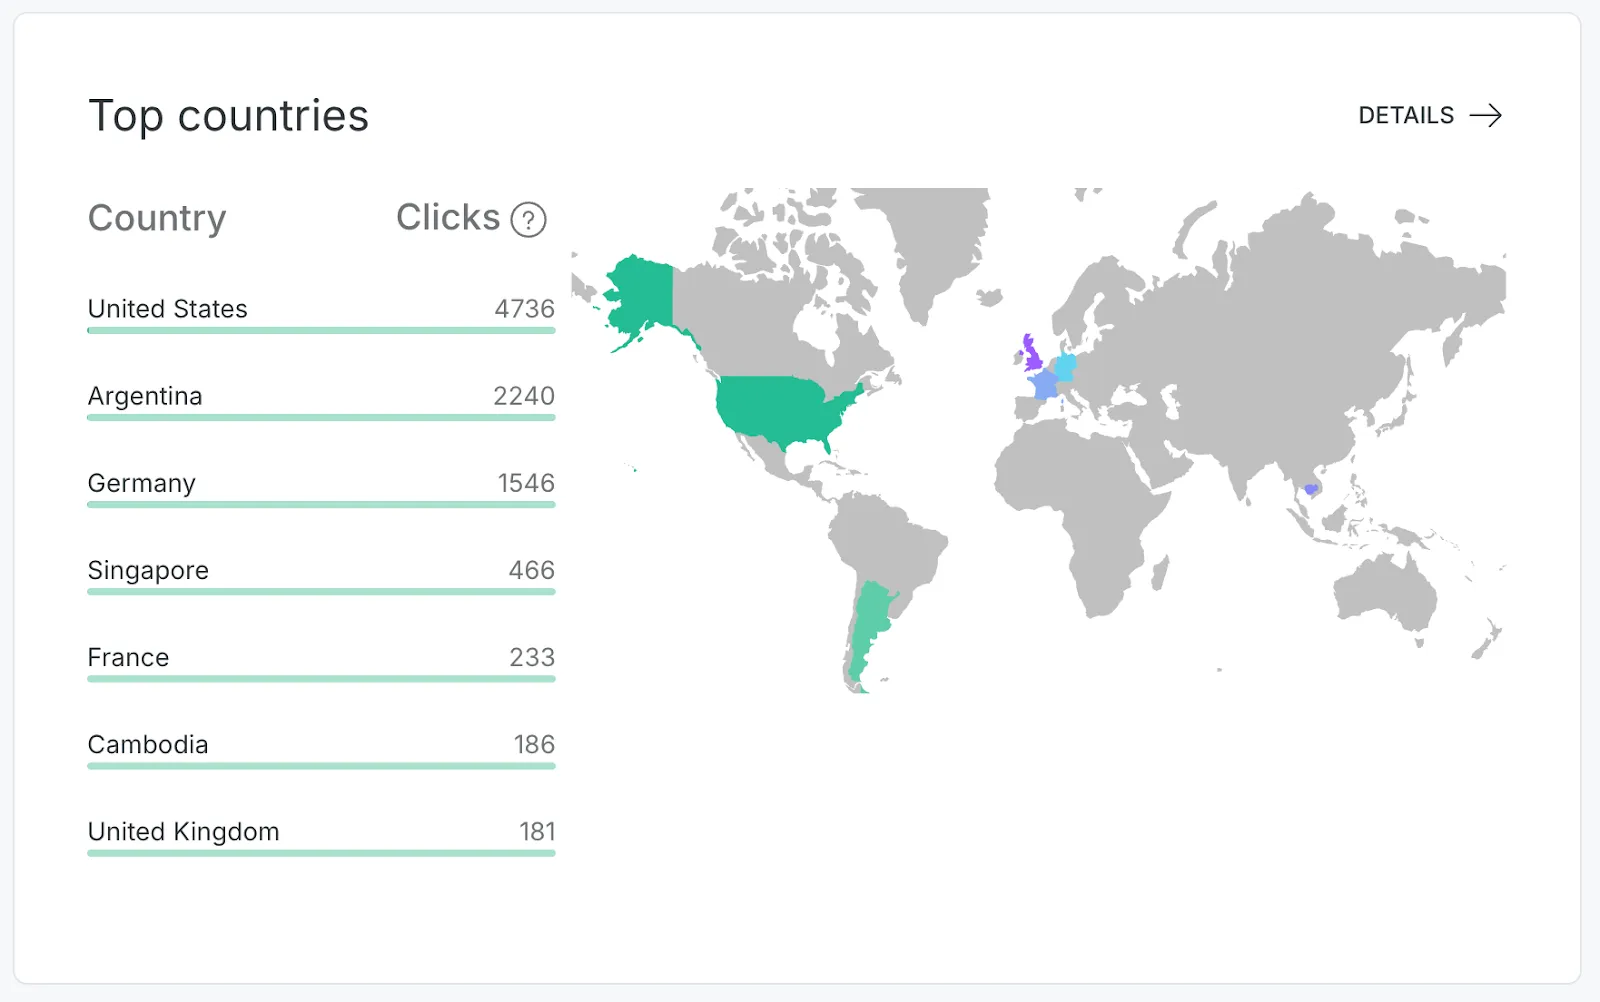
Even comes with a map. Useful for geography, too.
Below this, you can see each of these categories’ data separately, featuring even more detailed statistics.
Pressing “Details” gets you a bit more additional information.
Color-coded, for your convenience.
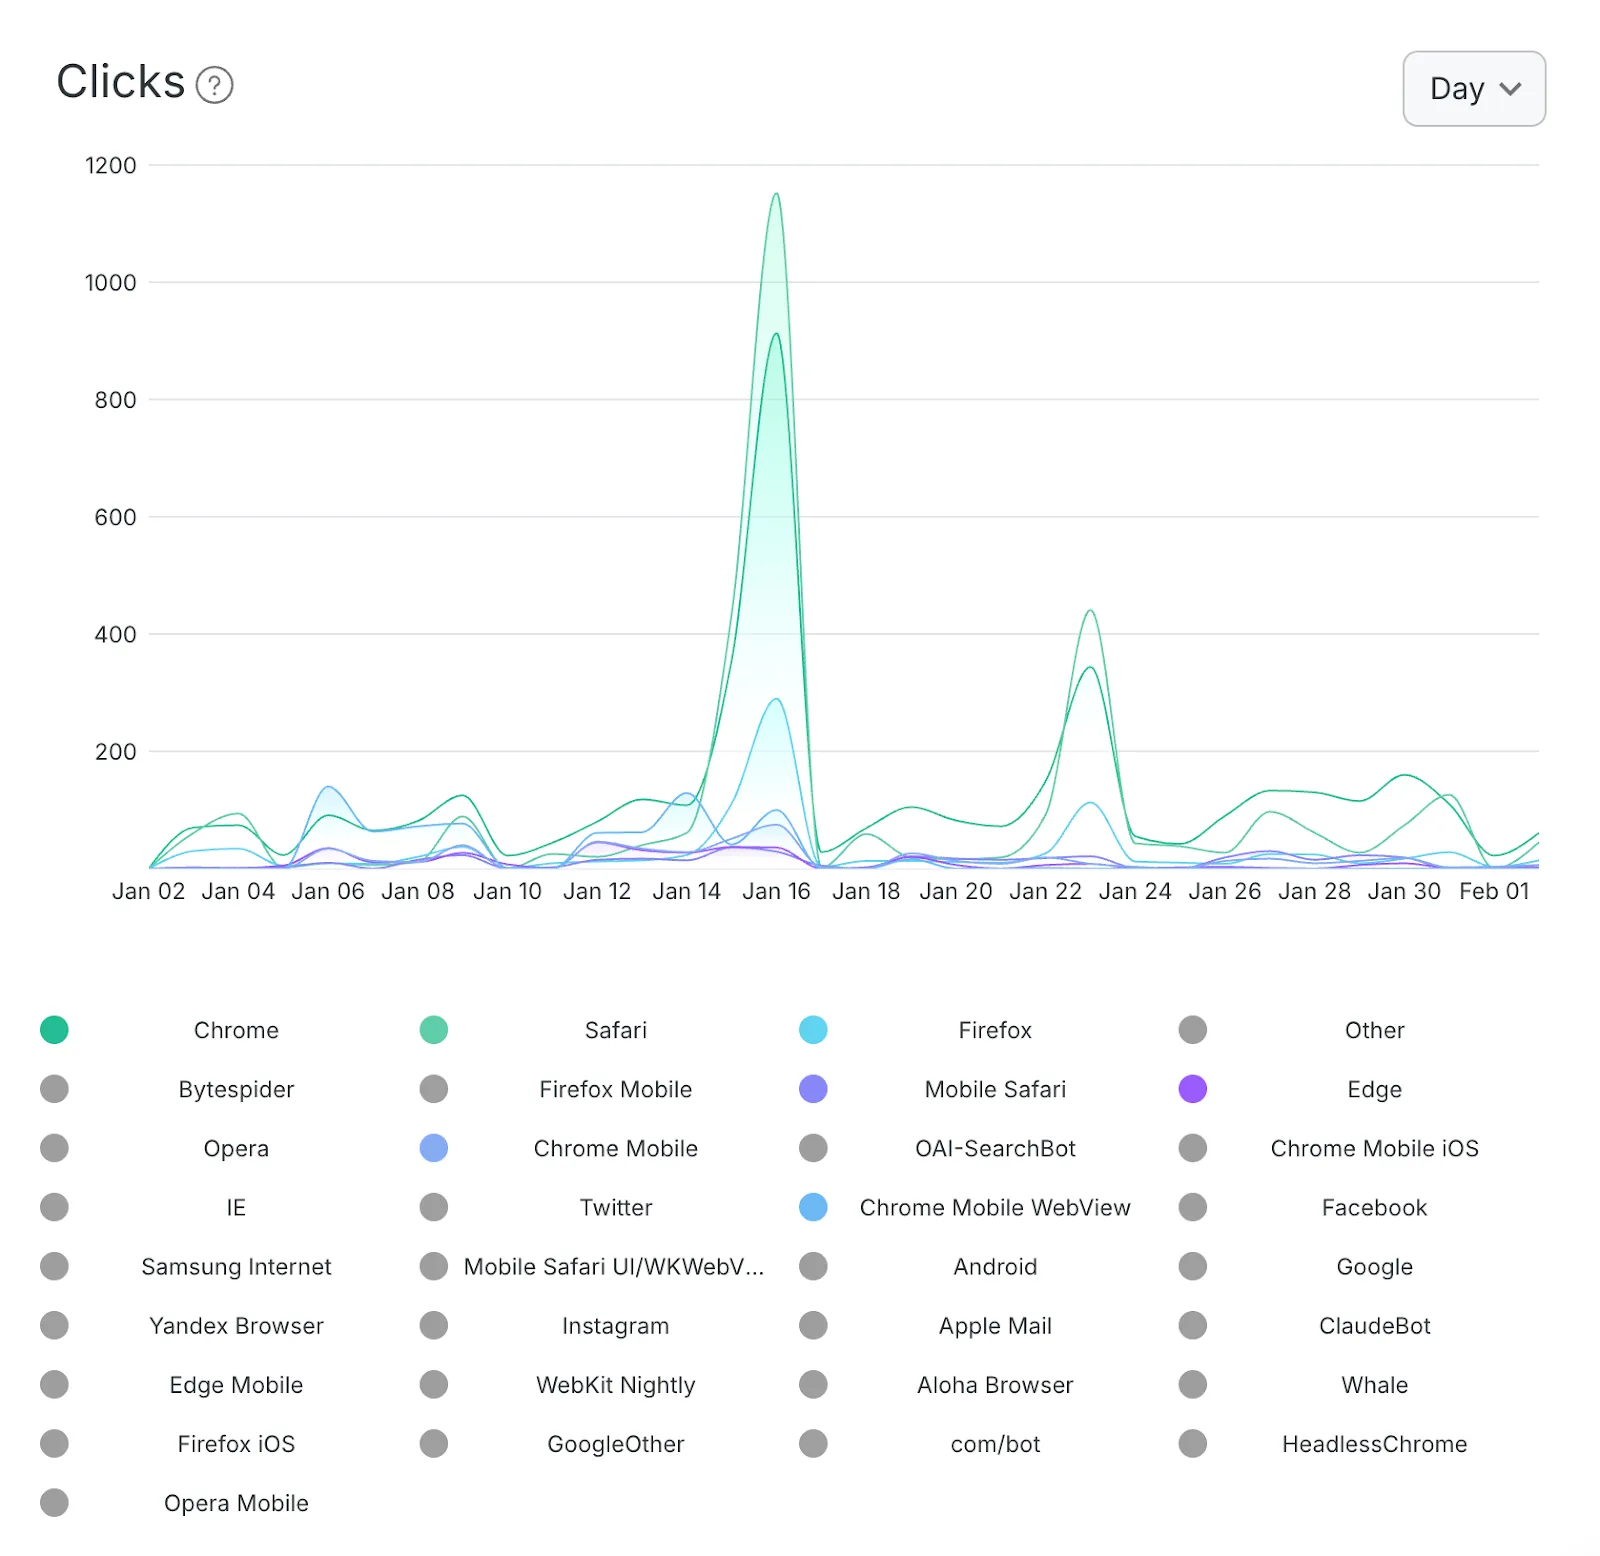
For example, here are the statistics for the “Top browsers” section of to.short.io, showcasing all the different browsers users are clicking your links from, as well as the total number of clicks from each.
You’ll notice that there’s things like “Instagram” and “Facebook”. Don’t be confused. This simply refers to access from those platforms’ built-in browsers.
You’ll also notice names like “Bytespider” and “OAI-SearchBot”. Sometimes, crawlers slip through.
If you want to limit crawlers further, check out this article.
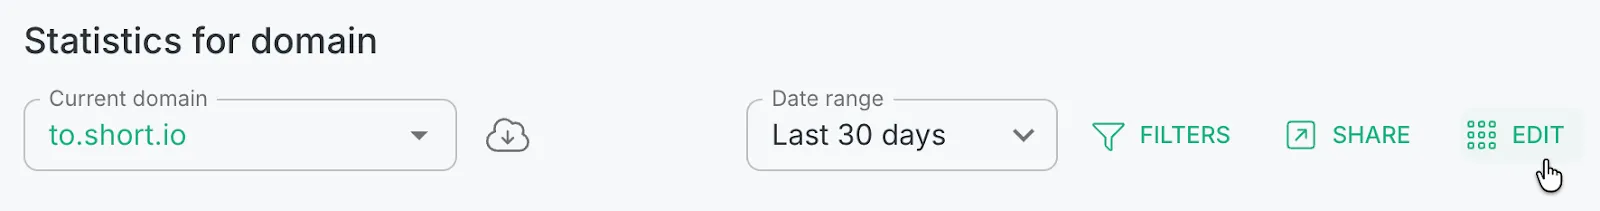
Get the exact hierarchy of information you need.
You can also reorder all the different sections by pressing the “Edit” button on the far right.
What else?
No, that’s it! Now you’re all caught up.
This is every single statistic you can see on Short.io.
With all that out of the way, let’s finally wrap this up.
😮💨 Whew!
We covered a lot of ground.
As mentioned above, Short.io offers tons of information.
And sure, it might be overwhelming at first. Lots and different types of information, spread across four separate tabs.
In truth, there’s always better and better ways to convey all of this data to you, which is why we’re always paying attention to how our users are using our platform, how their users are interacting with their links, and a lot more. Just so we can keep improving your experience.
We’re sure you’re already getting ideas about different approaches you can take to improve your shortlinks’ results.
Even better, we’ll help you take things to the next level.
But, this article is already long enough. So we’ve decided to split the information into two.
Next time, we’ll show you different ways to use disparate metrics together and learn even more about your users’ engagement and your links’ performance.
Stay tuned, as we have advice you likely haven’t considered.
See you soon!