From the day the online advertising has taken off, marketers have been experiencing some difficulties in measuring the success of online campaigns. How can businesses find out if the ads are profitable or, on the contrary, waste money to no avail?
Today, on the Short.io blog, we'll guide you through the tools that help money not go down the drain.
The reason of Calculating the Success of Online Advertising
Any advertisement is an investment. Every investor wants to evaluate the effectiveness of the invested funds. Advertisements could be unpredictable – some campaigns fail, the other ones have unexpected success. You'll never discover the reason for the ad behavior unless you collect, store, and measure the data of your campaigns and marketing strategy.
The advertisement campaigns can be based on different ideas, but each of them has the same measurement algorithm. They take origins from a source (search engine, social networks, websites) and lead through the CTA to an action on your site (make a purchase, fill out the form, subscribe).
You can use the built-in analytical tools to track the success of a campaign (Short.io statistics, Facebook/Twitter analytics). But, if you want to combine the results of multiple campaigns, this is where some advanced instruments take place.
The more scaled your online advertising strategy becomes, the less transparent your cost and profit are. In order not to end up with financial losses, using the proper tools matters.
The next level of measuring the advertisements' success is to estimate all campaigns in one overview. That is possible with the Google Analytics reports.
All campaign overview is used to estimate the success of each campaign in a comparable way. With the information gathered in one table, the list of campaign names and key metric success is established.
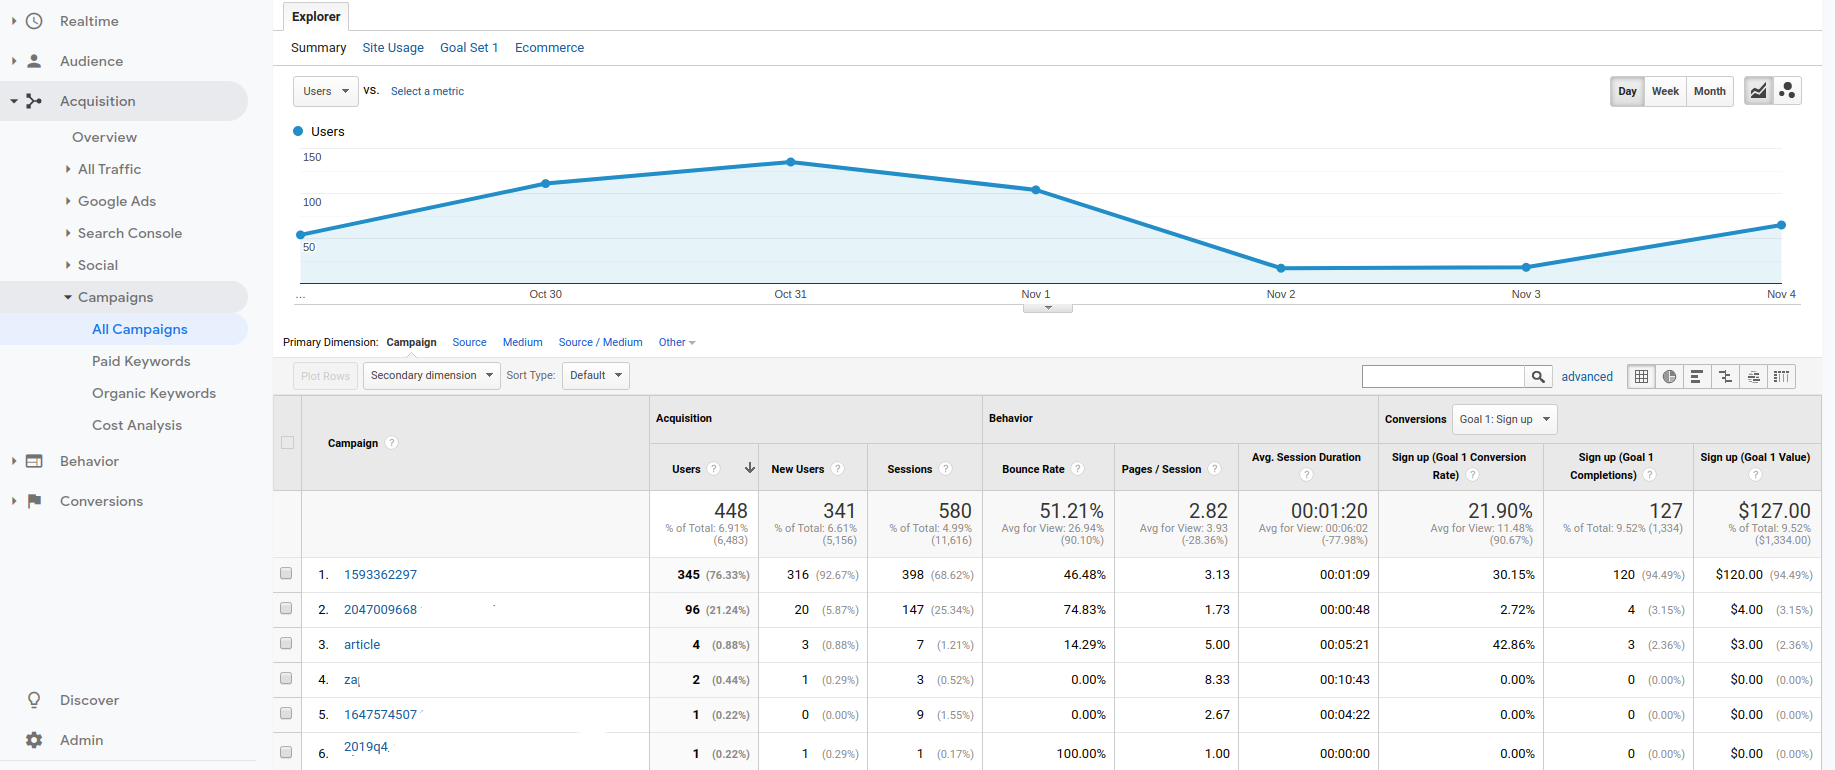
With this information, you can detect the most successful and failing ad. The Overview table contains a list of campaigns and the metrics that can be chosen depending on your needs. By adding dimensions you compare not only the overall number of clicks, but also the detailed data as for countries, devices, sources.
The Cost Analysis Report is helpful in allocating the budget effectively. It compares the advantages of each campaign you are running or each channel you are using. With the structured data, shown in the table, a comparison between the input and the output is established. Revenue and conversions are concluded based on the goals you set on Google Analytics.
Short.io Integration with Google Analytics
Try NowWith this information, you can see how successfully each campaign or channel performs. This can be an important step in improving your budget allocation or calculating return on investment.
The Cost Analysis contains a list of sources/mediums and the metrics that can be chosen depending on your goals. Some of them are:
- CTR
- CPC
- Clicks
- Sessions
- Impressions
- Cost
- ROAS
- RPC
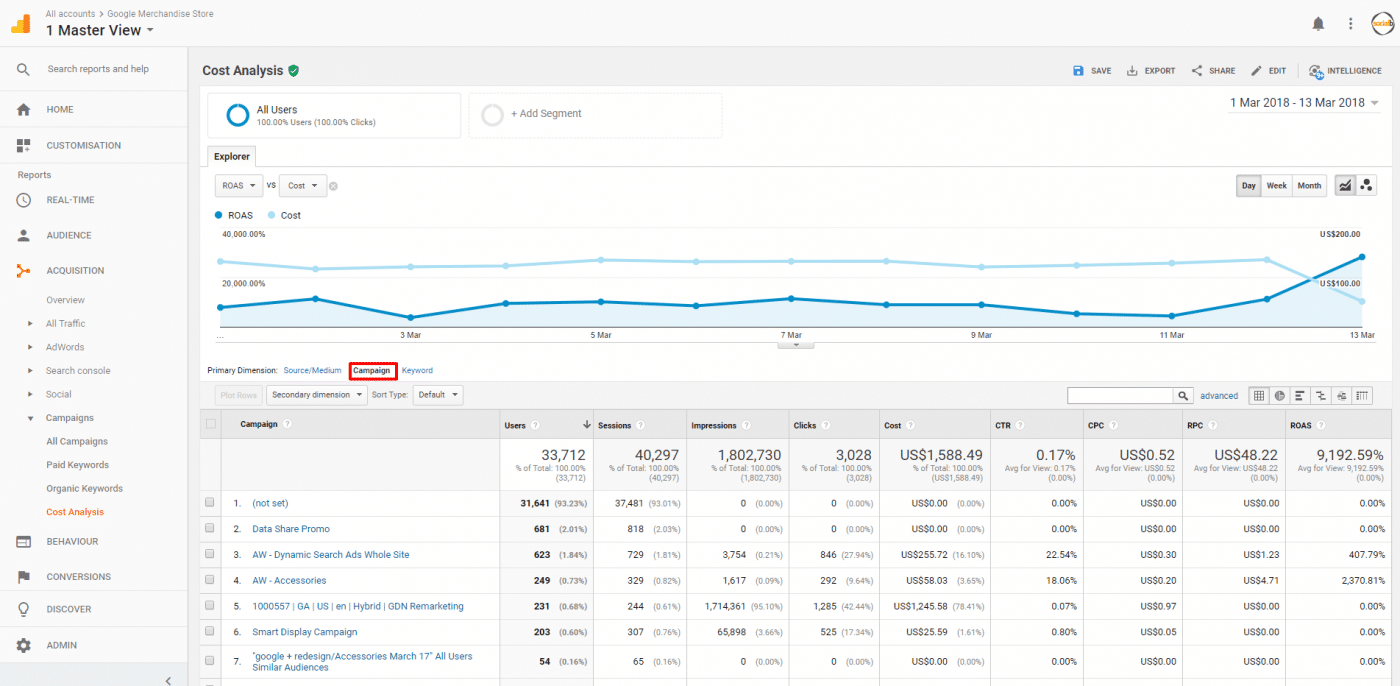
With this data, you get calculated ROAS (Return on Ad Spend) and RPC (Revenue per Click) to estimate whether the budget for each campaign is worth spending or not.
By launching an advertisement on Facebook or Instagram, Facebook Pixel can perform similarly to Google Analytics. FB Pixel helps to track the performance of campaigns. You can track how many leads have been generated by a particular ad.
Short.cm Integration with Facebook Pixel
Try NowThe campaign overview contains the list of ads that you are running and a set of metrics. The metrics can be changed depending on your needs. Note that the analysis of ads includes cost per result, so that you calculate the budget that you are spending on a campaign.
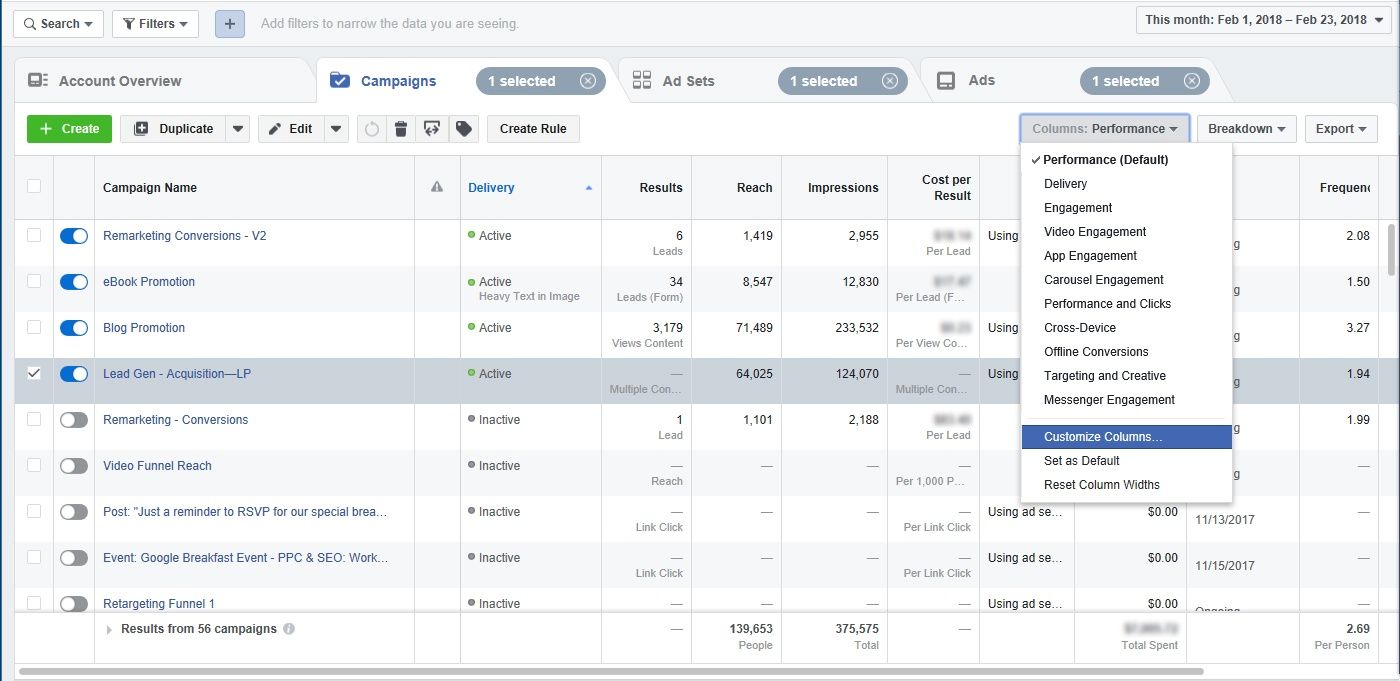
With this information, you can see how each campaign or channel performs and whether the budget that you have invested is worth it or not.
An advantage of Segment is that it allows integrating 100+ different analytical services without embedding codes. You need Segment to measure the success of advertising campaigns if pasting a JS code to the website sounds .
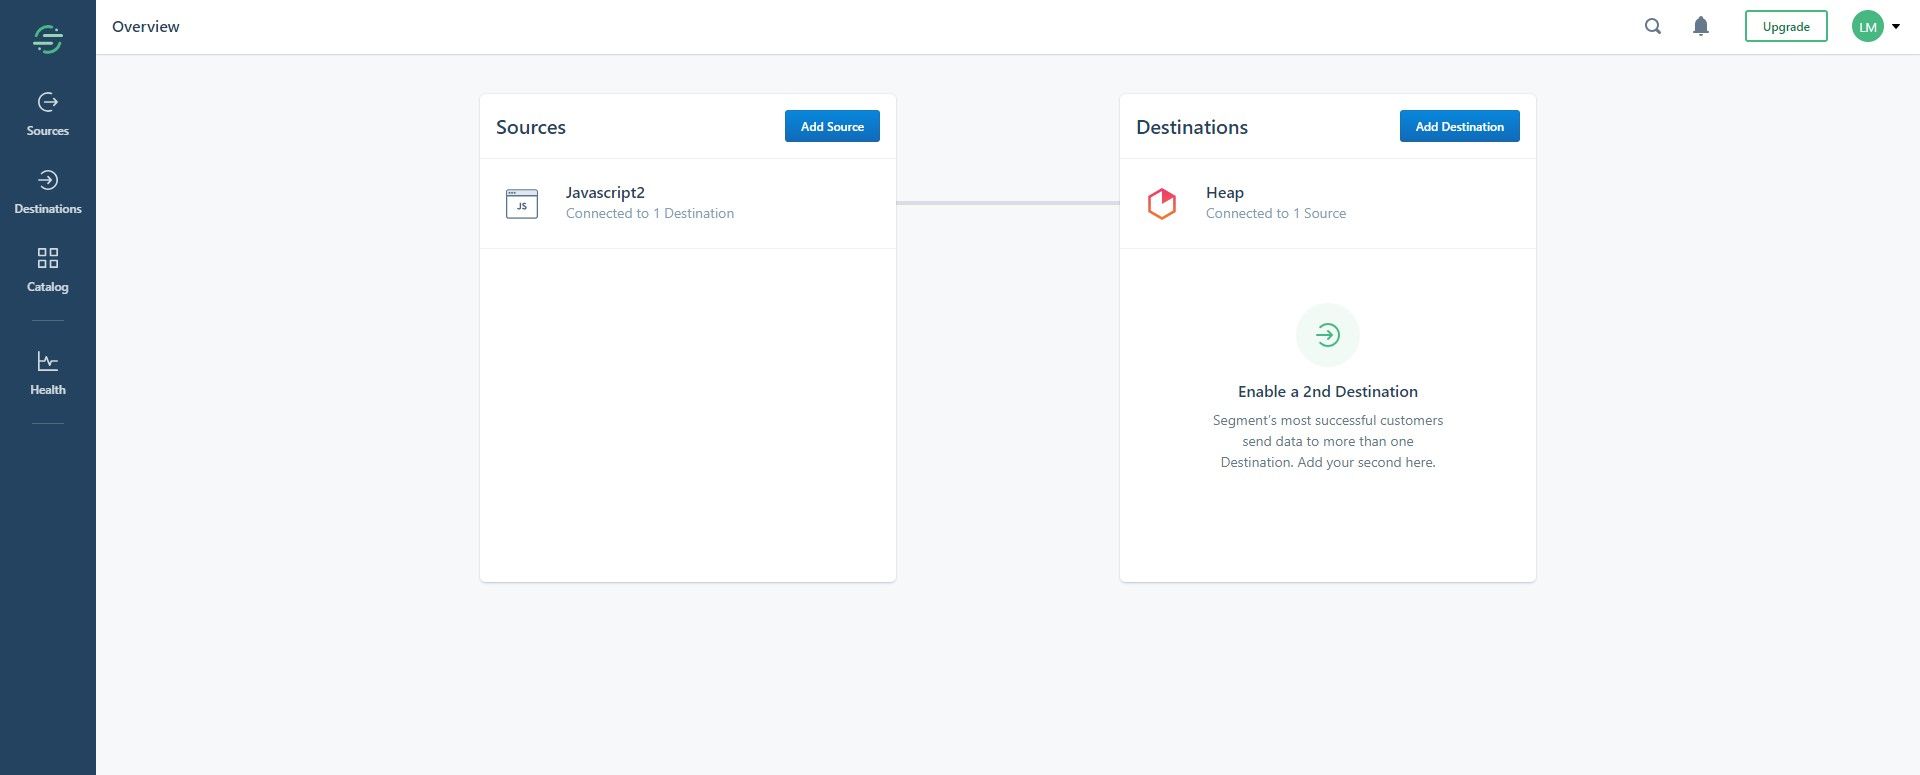
Many analytical apps such as multiple event-driving tools (Mixpanel, Amplitude), storing event data (RedShift, BigQuary), Google Analytics, and Facebook Pixel are available in Segment.
Short.cm Integration with Segment
Try Now-
Wrapping Up
The analysis is the basis of any activity that helps to detect some strengths and weaknesses of the actions. Track, measure, and evaluate your marketing campaigns to conduct effective and low-cost advertising.
What did you learn?
- What is the purpose of ad tracking?
- How do you track advertising effectiveness?
- Is Ad Tracking bad?
- How to estimate the effectiveness of short links
Read also:

